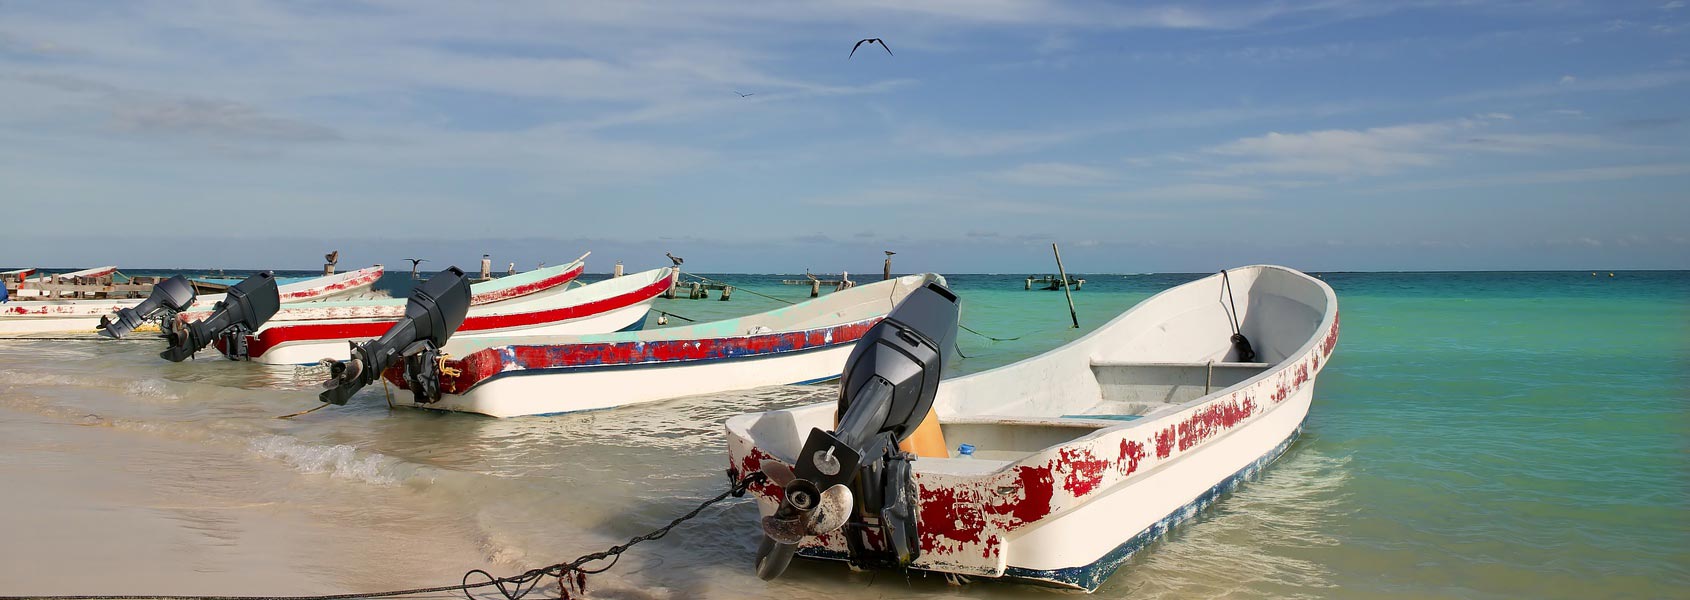
Sun-soaked white sand beaches and stunning turquoise and green water–there is no better place to experience this than in the Caribbean destination of Puerto Morelos in the Riviera Maya.
One of the dreaded nightmares when taking a tropical vacation is it rains your entire trip! While none of us can control the weather, it is nice to be informed of the weather patterns and what temperatures are generally like at certain times of the year.
GENERAL OVERVIEW
The typical weather in this part of Mexico (the Yucatan Peninsula), is absolutely fantastic! This is a huge contributing factor to Cancun and the Riviera Maya being one of the top draws for vacationers in the world. Puerto Morelos is no exception to that; the weather here is generally very pleasant.
Keep in mind that there are two seasons in the tropics (corresponding to winter and summer in the US and Canada. The rainy season is during the summer months and the dry season during the winter months of those countries.) The temperature, although very consistent, does fluctuate somewhat through those months. As an example, the hottest month of the year in Puerto on average is June and the coolest month on average is January.
BREAKDOWN OF THE AVERAGES
The rainy season runs from June to November; September being the rainiest month of the year. Also, as mentioned, those are the hottest months, with high humidity. Temperatures from May to September have a high of over 90° Fahrenheit (32° Celsius), and a low of around 74° F (23° C).
The dry season spans the other half of the year (December to May). These months are also considered the high season or busy season in Mexico because they are the winter months for tourists coming from the Northern Hemisphere.
Generally speaking, dry season offers the most comfortable weather–high of 88°F, low of 75°F–and the most sunshine in Puerto Morelos, as well as in the rest of the Yucatan. It’s noteworthy, though, that you can have some cool days during this time of year. The ocean water temperature also drops to the high 70’s°F (around 26° C), which can make breezy evenings a bit chilly.
TIP: Check the local weather a week or so before you plan to arrive. Pack a cardigan, long-sleeved shirt, hoody and some pairs of pants if you’re planning to visit in January or February.
MONTHLY BREAKDOWN
January
Excellent Weather…The average temperature is around 73°F/23°C, with very stable weather systems and an average of 3 inches of precipitation throughout the month. This is one of the cooler months of the year, especially in the evening hours. Mostly sunshine but just coming out of the rainy season, so there is a possibility of a few rainy days; an average of 6.4 rainy days in the month.
February
Excellent Weather… The average temperature is around 74°F/23°C. Very similar to the month of January, it’s generally consistent weather with little to no storm activity. Cooler evenings but very sunny days and only 2 inches of precipitation; 4 rainy days on average during the month.
March
Excellent Weather… The average temperature is around 76°F/25°C. The temperature starts increasing a bit in March from the past few months. The spring months are a nice time of year in Puerto Morelos, continuing to have very little rain–1.7 inches of precipitation on average through the month, and 3 rainy days. Also, the winds start to let down a little, which makes for calmer seas (although in Puerto the water is always calm because of the protective natural reef barrier).
April
Excellent Weather… The average temperature is around 80°F/26°C. Continuing with the trend of the past month, almost every day is a fantastic beach day. The days are hot and the evenings are comfortable. There is still a nice soft breeze and little to no rain. April averages 2 inches of rain and 3 rainy days during the month.
May
Very Good Weather… The average temperature is around 82°F/27.8°C. Things are starting to heat up during the month of May, and the humidity rises as well. The average low jumps up to around 74°F/23°C, which was the average daily temp for the month of January. It is also the month leading into hurricane season, so the rainfall can be a little less predictable. May averages 4 inches of rain for the month, which still isn’t bad; only 5.4 rainy days.
June
Hot Weather… The average temperature is around 82.6°F/28°C. The months of June and July are typically the hottest of the year. You’ll need your air conditioning! June also marks the beginning of hurricane season in this part of the world (runs through November). Hurricane season equals unpredictable weather–storms can start to pop up seemingly out of nowhere. Usually in June, some small storms blow through quickly and then the sunshine returns. 5.4 inches of precipitation with an average of 8.9 rainy days in June.
July
Hot Spotty Weather… The average temperature is around 83°F/28.4°C. Like June, it’s HOT and high humidity with very little breeze typically. Since it’s rainy/hurricane season, the weather can be very hard to predict, so have the expectation of inconsistent weather. For some reason, July averages a bit less rainfall than June and August–about 3.6 inches of rain on average, and 7.8 rainy days.
August
Hot Spotty Weather… The average temperature is around 82.9°F/28.3°C. It’s HOT and the rain and storms pop up regularly. Similar to June and July, just be prepared for good sunny days mixed with rain and clouds. Average precipitation for the month is 5 inches. There’s an average of 9.8 rainy days though, so clouds and rain are far more common during these months. Pack a jacket and an umbrella just in case.
September
Rain, Rain, Rain… The average temperature is around 82°F/27.8°C. This is the wettest month of the year on average by a healthy margin. It is still pretty warm and the storms or bad weather can get socked in for days at a time. That doesn’t mean you won’t have nice hot sunny days, but the weather is definitely more unpredictable. The average amount of precipitation is 7.4 inches, with an average of 12.9 rainy days that month. With October a close second the most likely chance of getting rained on.
October
Still Rain, Rain, Rain… The average temperature is around 80°F/26°C. October is a close second behind the month of September for getting the most rain. Evenings are starting to cool back off a bit though, and the daytime heat isn’t as intense, so the month can offer some nice beach days. The average precipitation is 7.2 inches, with 11.8 rainy days for the month.
November
Good Weather… The average temperature is around 77°F/25°C. November marks the end of hurricane season and the weather starts to stabilize again. Things have cooled back down to where it’s super nice and comfortable. You still can encounter some showers possibly, but none that will stick around for long. The average precipitation is 3.9 inches, with 8.7 rainy days.
December
Very Good Weather… The average temperature is around 74.7°F/23.7°C. December is an excellent month with cooler weather and bright, sunshiny days. There still may be the random shower, but for the most part, things are very nice and the breeze is returning and makes for great beach days. The average precipitation for the month is 2.9 inches, with 7 rainy days.
FUN FACT: Why does the weather in Puerto Morelos tend to be a little more consistent than Cancun and Playa del Carmen? There are no islands directly off its coastline, whereas the cities of Playa del Carmen and Cancun have Cozumel and Isla Mujeres a few miles from their shores. This creates some interesting weather at times, due to the different temperature capacities of the land and sea.
There is no doubt that Puerto Morelos is one of the best destinations in the Yucatan Peninsula for balmy temperatures. The weather overall is beautiful!
